In this part, we show how to use dexter to apply the market basket approach (Mislevy 1998) to the mathematics domain in PISA 2012, following the logic in Zwitser, Glaser, and Maris (2017). Once we have read in the data and created the dexter database, as shown here, this takes only several lines of code. Still, the article will be a bit longer as the market basket approach deserves some attention on its own.
The market basket approach has been borrowed from economics – more precisely, from the study of inflation and purchasing power. To confuse matters further, the machine learning field has appropriated the term to denote something completely different – we can ignore this except that their version is the more likely to show up on top in a Google search.
A market basket contains a mix of goods and services in given proportions that, by social consensus, mirrors the prevalent consumption patterns; the cost of obtaining it, in money or work time, can be compared across countries or over time. The idea is simple but the implementation is not trivial. In comparisons over time, the contents of the basket cannot remain constant forever. In the 1970s, your teenager vitally needed a cassette recorder, today it is a smartphone. The commodity that you buy – domestic peace – is the same, but the physical carrier has changed.
In comparisons across countries or social groups, one may ask: whose basket? For example, the basket of older people contains mostly food and health care; minimal changes in the prices of these may be barely perceptible for richer, active people, but they may have a large impact on the welfare of the specific group. Because of this, many national statistical services maintain separate price indices for the retired.
It appears, however, that no statistical office has come to the idea of representing inflation or purchasing power as an unobservable value on an arbitrary scale. This has been the privilege of psychometricians. Society asks us a simple question – for example, how well 15-year old students around the globe have mastered mathematics – and we respond by educating them about the mathematical properties of our favorite abstractions.
One of the ways to come back to reality has been standard setting – a procedure in which a panel of experts tries to relate cut points on the Great Unobservable to specific skills that candidates are socially expected to have. dexter has some support for standard setting: it is compatible with software implementing the 3DS method (Keuning, Straat, and Feskens 2017).
The market basket approach, as introduced by Mislevy (1998), is seen primarily as a way to report results of educational surveys in a way that will be more transparent to the public and policy makers, and simplify a key step in the standard-setting process, namely, mapping item- or booklet-level judgements to the reporting scale.
Rather than goods and services, the educational market baskets contains items that, by social consensus again, mirror the skills that students are expected to develop. It is essential that the scoring rules are well defined. Tests are typically scored with the sum score. The number of items in the basket may be commensurate with the typical length of a test – in that case, it is easy to publish the items themselves along with the test results.
Alternatively, the market basket may be larger – even as large as the domain. Forgetting for a while about the concept of infinite item pools, we notice that a good collection of maths problems like this one covers “the areas of Algebra, Geometry, Counting and Probability, and Number Sense … over 500 examples and problems with fully explained solutions represent the commonly seen competition questions and essential strategies experienced and developed by all the authors throughout their math careers”. We can safely think of this as the domain. Others may swear by a different collection, but there will be considerable overlap. If the domain is captured in about 500 problems that we can possibly teach, then the 109 items asked in all countries participating in PISA 2012 must represent it rather well.
Of course, we cannot administer 500 or even 109 items to any student, so we can do the usual and distribute them among a number of test forms (booklets) in a connected design. PISA 2012 had 21 booklets for the maths domain. To apply the market basket approach, we fit an IRT model, we draw plausible values given the responses and the item parameters, and we use the plausible values and the model to predict the missing responses. All that remains is compute sum scores over the whole domain, using actual responses where the item was administered and predicted ones where it was not.
We are accustomed to the view of classical test theory (CTT) used as a prelude to IRT modelling, but the market basket approach follows a circular route from CTT to IRT and back to CTT. In this process, IRT modeling appears more like an intermediate stage where it solves the issue it shines in: the missing data problem.
In the context of an international comparative survey like PISA, Zwitser, Glaser, and Maris (2017) go one step further and propose to predict the missing scores from country-specific IRT models. A country-specific model will achieve better fit and predict better than an overall model. Once the missing scores have been filled in in the best way possible, we apply the same summary function to all national data sets. It is a popular one, and available in basic R: rowSums.
On to work, then.
library(dexter)
library(dplyr)
library(ggplot2)
db = open_project('pisa2012.db')
Note that the nice data base that we created last time is available and ready for analysis, including the item property that determines which items go into the basket. Once again: these are the items that were administered in all countries, though not necessarily to all students within a country.
As a start, let us draw some plausible values (one per person is enough). This is basically the PISA approach, and even if we don’t get exactly their numbers, it is some basis for comparison. First, extract response data with two extra variables added: (i) the country (cnt), which will be necessary for country-specific IRT modeling, and (ii) in_basket, the item property that indicates whether an item belongs to the market basket (most do). Then, select just the responses to the items in the basket:
resp = get_responses(db,
    columns=c('person_id', 'booklet_id', 'item_id', 'item_score', 'cnt', 'in_basket')) %>%
    filter(in_basket==1)
pv = plausible_values(resp, nPV=1)
For the country-specific estimation, we have to trick a bit. We know in advance that there are two instances in which an item did not get a correct response in one country, so we have to do a minimal adjustment to be able to fit the IRT model. Other than that, all we have to do is group the data by country and execute the plausible_scores function in a do:
ps = resp %>%
  filter(!(cnt=="VNM" & item_id=="PM828Q01") & !(cnt=='JOR' & item_id=='PM909Q01')) %>%
  group_by(cnt) %>%
  do({ps=plausible_scores(., nPS=1)})
Almost done. Combine the plausible values and the plausible scores (the latter conveniently contain the country indicator), group by country, aggregate, plot:
league = ps %>%
  left_join(pv, by='person_id') %>%
  group_by(cnt) %>%
  summarise(Traditional=mean(PV1), Basket=mean(PS1))
plot(league$Traditional, league$Basket, xlab="Traditional", ylab="Market basket")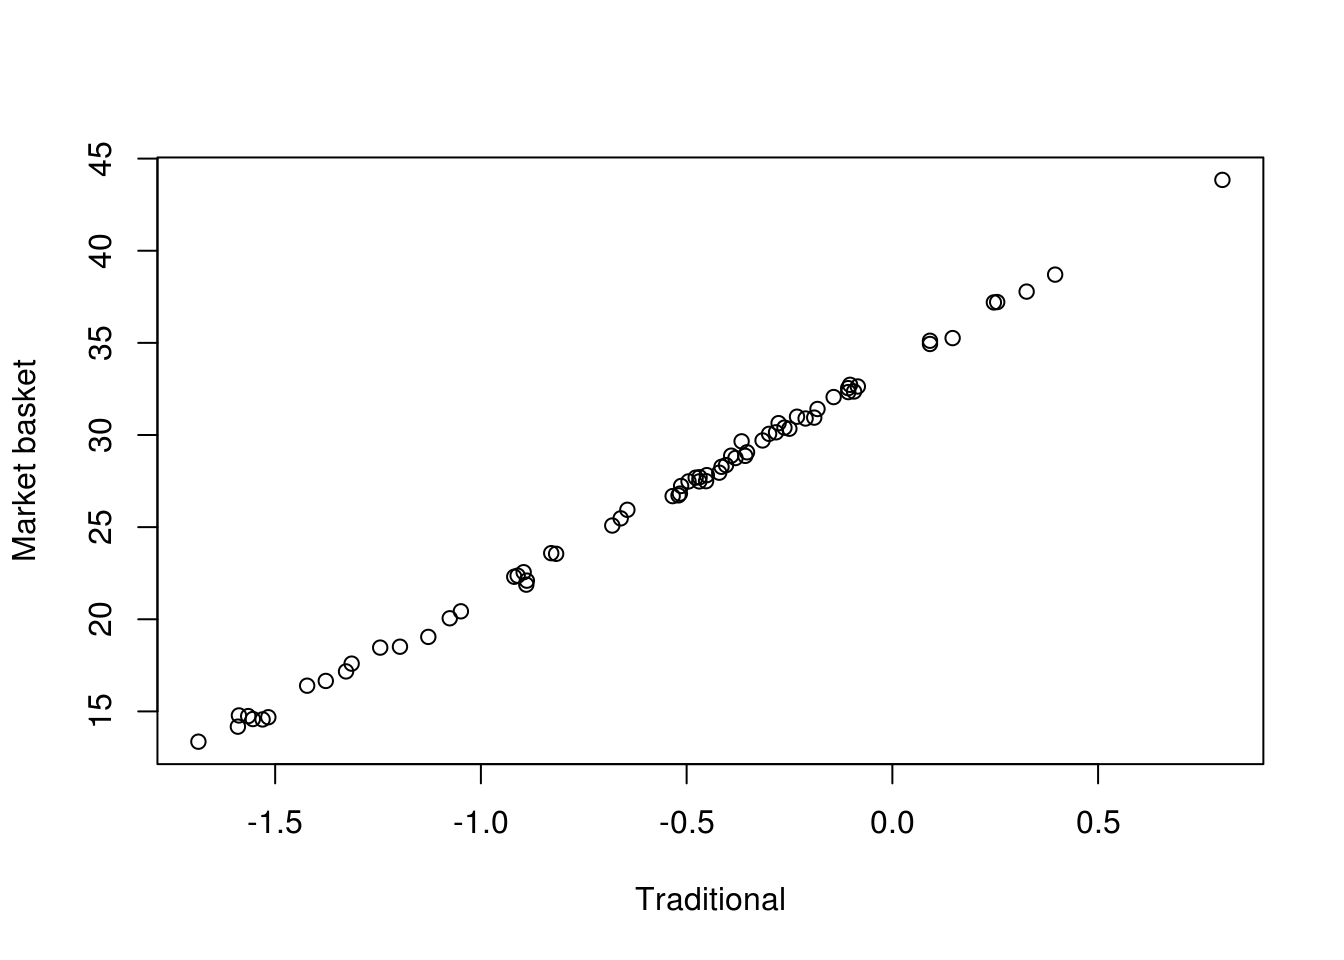
It appears that the two methods rank the countries in more or less the same way. Whether this is perceived as a good or a bad thing depends on the point of view. To others, it may look as if we have not contributed anything new. From our perspective, PISA 2012 results are close to what we believe is the state of the art. This is not always the case – some alternative methods can produce very different results, as we hope to show in future posts.
In closing, we observe that the data management model of dexter, which fully ‘understands’ the structure of multi-booklet designs, is very practical – far more than the SPSS and SAS files that PISA have been delivering. The situation took a turn for the worse in 2015 when the ASCII data – syntax file pairs were abandoned in favor of huge binary files. These have enormous memory demands when being read into R, which is a bit difficult to swallow as they contain a huge amount of missing value indicators while not being self-sufficient. All these difficulties are eliminated in the dexter data base, which is also a single file but ready to roll.
References
Keuning, Jos, J. Hendrik Straat, and Remco C. W. Feskens. 2017. “The Data-Driven Direct Consensus (3dc) Procedure: A New Approach to Standard Setting.” In Methodology of Educational Measurement and Assessment, 263–78. Springer International Publishing. doi:10.1007/978-3-319-50856-6_15.
Mislevy, R. J. 1998. “Implications of Market-Basket Reporting for Achievement-Level Setting.” Applied Psychological Measurement 11 (1): 49–63.
Zwitser, Robert J., S. Sjoerd F. Glaser, and Gunter Maris. 2017. “Monitoring Countries in a Changing World: A New Look at Dif in International Surveys.” Psychometrika 82 (1): 210–32. doi:10.1007/s11336-016-9543-8.